
I have seen a lot of interest in the field about using Couchbase with R. It is an easy integration, so here you have some examples to start using it right now.
As a little background, R is a language and environment for statistical computing and graphics. You will find it in the firsts positions in best languages rankings for Data Analysis, Machine Learning or Data Crunching. Data Scientist use R as one of their most powerful tools.
For data ingestion, R can load files in different formats like csv, excel, html, plain text, and more with a simple command line. R can also load data from remote sites using HTTP, and can easily work with JSON.
With all of this in mind, how can we load data from Couchbase into R? Do we need a special adapter? N1QL is the answer. Couchbase query engine accept REST requests, returning JSON documents, so we can directly import data into R. No extra components needed.
Here you have some examples with data from the “travel-sample” bucket, included in Couchbase as an example data set. I am using here the versions R 3.4.1 and Couchbase 4.6.2.
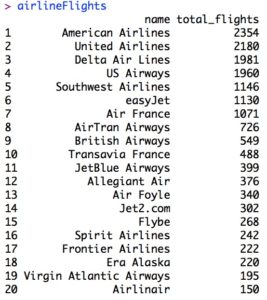
As first exercise, let us load the top 20 airline companies with more flights in our system. We will load this data into an R Data Frame, show the results in the console and built a simple bar graph.
From Couchbase side, this is the query to run:
|
1 2 3 4 5 6 |
SELECT a.name, count(*) as total_flights FROM `travel-sample` r JOIN `travel-sample` a ON KEYS r.airlineid WHERE r.type ="route" AND a.type="airline" GROUP BY a.name ORDER BY total_flights DESC LIMIT 20 |
For the R side, we will use the R Console. First, we have to import the libraries used in this exercise:
|
1 2 3 4 |
library(httr) library(jsonlite) library(ggplot2) library(leaflet) |
Next step is to build some variables, including the Couchbase Query node address and the query. Note the escaped double quotes (\”):
|
1 2 |
cbServer <- "http://cb451box:8093/query/service" query <- "SELECT a.name, count(*) as total_flights FROM `travel-sample` r JOIN `travel-sample` a ON KEYS r.airlineid WHERE r.type =\"route\" AND a.type=\"airline\" GROUP BY a.name ORDER BY total_flights DESC LIMIT 20" |
Then we must construct the HTTP request, and read the response in JSON format:
|
1 2 |
req <- httr::POST(cbServer, httr::add_headers("Content-Type" = "application/x-www-form-urlencoded;charset=UTF-8"), body = paste("statement=", query)) res <- fromJSON(httr::content(req, "text")) |
NOTE: If you are using a password protected bucket you have to include credentials as the following:
|
1 2 |
creds <- "[{\"user\":\"local:bucketName\", \"pass\":\"password\"}]" req <- httr::POST(cbServer, httr::add_headers("Content-Type" = "application/x-www-form-urlencoded;charset=UTF-8"), body = paste("statement=", query, "&creds=", creds)); |
Then we can save the result in a variable.
|
1 |
airlineFlights <- res$results |
To see the value it is enough to type the variable name:
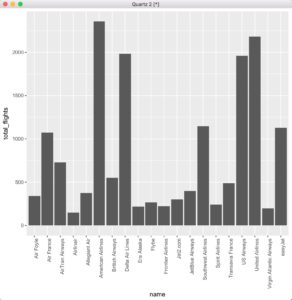
We can also build a bar graph using the ggplot library:
|
1 |
ggplot(data=airlineFlights, aes(x=name, y=total_flights)) + theme(axis.text.x=element_text(angle=90,hjust=1)) + geom_bar(stat="identity") |
This is the result:
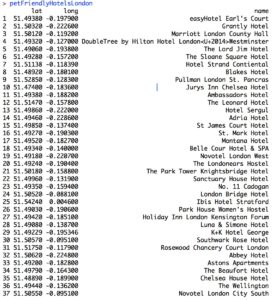
As a second example, we are going to search for the available pet friendly hotels in London, and show them over a map. The N1QL query is like this:
|
1 2 3 |
SELECT name,geo.lat as lat,geo.lon as long FROM `travel-sample` WHERE type="hotel" AND city="London" AND pets_ok=true |
The R code to execute the query and save results:
|
1 2 3 4 |
query <- "SELECT name, geo.lat as lat, geo.lon as long FROM `travel-sample` WHERE type=\"hotel\" AND city=\"London\" AND pets_ok=true" req <- httr::POST(cbServer, httr::add_headers("Content-Type" = "application/x-www-form-urlencoded;charset=UTF-8"), body = paste("statement=", query)) res <- fromJSON(httr::content(req, "text")) petFriendlyHotelsLondon <- res$results |
This are the results:
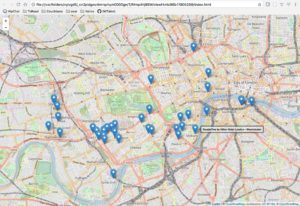
Now we can use the leaflet library for drawing the results over a map:
|
1 |
leaflet(data = petFriendlyHotelsLondon) %>% addTiles() %>% addMarkers(~long, ~lat, popup = ~as.character(name), label = ~as.character(name)) %>% addProviderTiles(providers$OpenStreetMap) |
The map is opened in a browser:
 That’s all. I hope this is useful as first steps in using Couchbase from R. Happy Data Analysis!
For more detail, visit:
N1QL REST API reference
R: The R Project for Statistical Computing
Leaflet for R
Hi,
How to handle if I have multiple URL to hit n1ql.
Regards
Hello Snehashis.
When using any Couchbase SDK like node.js, Java, .Net, etc, you get a cluster map from the initial connection, and the client knows how to balance requests to the query enabled nodes.
Using R, you do not have such a client, so there is no “cluster view”, and you have to manage server address from your code. In summary, you have to choose one query node from your cluster.