
Tag: data visualization

What is Data Analysis? (Types, Methods, and Tools)
Data analysis is the process of cleaning, transforming, and interpreting data to uncover insights, patterns, and trends. It plays a crucial role in decision making, problem solving, and driving innovation across various domains. In addition to further exploring the role...
Couchbase Product Marketing
December 17, 2023

Couchbase Server 7.0.2 according to the rule of 3’s
Couchbase Server 7.0.2 is Available A few months ago, I could not wait for the latest release of Couchbase Server. Its number was seven, and my house number is 77. I felt that seven was a lucky number. But beyond...
Jeff Morris, VP Product Marketing
December 8, 2021

Level Up Your Data Visualization with Charts in Couchbase 7.0.2
If a picture is worth a thousand words, data visualization is worth a thousand data points. With the release of Couchbase 7.0.2, the Query Workbench (and the Analytics Workbench) now include a Charts tab that allows you to create charts...
Isha Kandaswamy
October 22, 2021

Training a Linear Regression Model with Couchbase & a Jupyter Notebook: Step-by-Step Tutorial
Data scientists love Jupyter Notebooks – and it makes a natural pairing with the Couchbase document database. Why? The Jupyter Notebook web application lets you create and share documents that contain narrative text, equations and the like for use cases...
Agrima Khanna
October 6, 2021
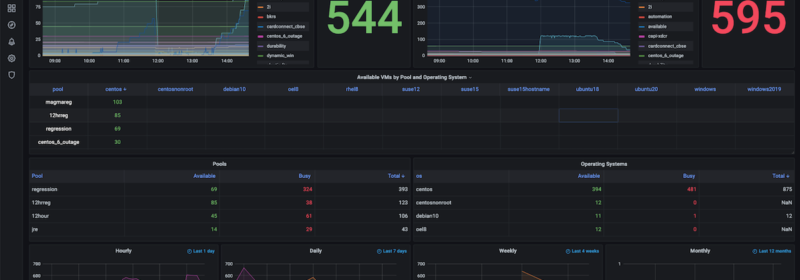
How to Build Observability Dashboards with Prometheus, Grafana & Couchbase
You’ve certainly heard it before: “What gets measured gets done.” It’s true: what you observe and measure is what you can improve. The key to any improvement is to first identify what to measure and then collect the related metrics....
Jake Rawsthorne & Jagadesh Munta
September 23, 2021

Build Real-time Dashboards – Couchbase Analytics & Tableau
This blog covers how to set up a Couchbase Analytics cluster in under 5 clicks and create a real-time visualization dashboard with Tableau. Introduction Couchbase Server is a hybrid NoSQL database that supports operational and analytical workloads. Couchbase Analytics in...

Connecting to Couchbase via ODBC
Couchbase Analytics Couchbase Data Platform now supports hybrid transaction/analytical processing (HTAP) workloads. Plus, our massively parallel processing (MPP) query engine lets users run ad-hoc analytical queries that deliver faster insights without impacting performance. Couchbase Analytics reduces the time to insight...
Sachin Smotra, Director Product Management, Couchbase
November 27, 2018

Data Visualization with Couchbase and Knowi
Note: This post uses the the Couchbase Analytics Data Definition Language as of the version 5.5 preview release. For updates and information on breaking changes in newer versions, please refer to Changes to the Couchbase Analytics Service. Data visualization and reporting...
Matthew Groves
June 13, 2018