
Previous blogs gave a better understanding on how our approach to Real Time Observability (RTO) in general helps troubleshooting distributed systems and why we chose OpenTracing as a foundation and public API. If you haven’t already, you can check out those blogs here and here.
In this blog, you’ll learn how RTO works with the Java SDK and how you can use it today for your benefit.
Getting Started
As soon as the Java SDK 2.6.0 (or later) version is released, you can grab it through the usual ways as described here. Since this version is right now in a preview release state, you need to access it from our own maven repository. Through a maven pom.xml:
|
1 2 3 4 5 6 7 8 9 10 11 12 13 14 15 |
<dependencies> <dependency> <groupId>com.couchbase.client</groupId> <artifactId>java-client</artifactId> <version>2.6.0-dp1</version> </dependency> </dependencies> <repositories> <repository> <id>cb-pre</id> <name>Couchbase Prerelease Repo</name> <url>http://files.couchbase.com/maven2</url> </repository> </repositories> |
The only difference you will notice is a new dependency called opentracing-api which we’ll talk about in a bit. Since this is not a major release, all previous code will work as before and you’ll benefit from the enhancements right away.
If you need to customize the tracer itself or some of its configuration, you can do this through the CouchbaseEnvironment.Builder as with all the other settings. Here is an example on how to customize our default tracer to reduce the time interval when the information gets logged:
|
1 2 3 4 5 6 7 |
Tracer tracer = ThresholdLogTracer.create(ThresholdLogReporter.builder() .logInterval(10, TimeUnit.SECONDS) // log every 10 seconds .build()); CouchbaseEnvironment env = DefaultCouchbaseEnvironment.builder() .tracer(tracer) .build(); |
Threshold Logging Explained
To get our feet wet with the threshold logging tracer (which is on by default) we are going to customize its settings a bit and lower the thresholds so low that practically every request and response are covered. Obviously this is not a good idea for production, but it will help us get to the desired log output quickly and assert its functionality.
Apply the following configuration as outlined above:
|
1 2 3 4 5 6 |
Tracer tracer = ThresholdLogTracer.create(ThresholdLogReporter.builder() .kvThreshold(1) // 1 micros .logInterval(1, TimeUnit.SECONDS) // log every second .sampleSize(Integer.MAX_VALUE) .pretty(true) // pretty print the json output in the logs .build()); |
This will set our threshold for key/value operations to one microsecond, log the found operations every second and set the sample size to a very large value so everything will be logged. By default it will log every minute (if something is found) and only sample the top 10 slowest operations. The default threshold for key/value operation is 500 milliseconds.
With these configs in place we are ready to run some operations. Feel free to adjust the following config so that it points to your server and applies the appropriate credentials:
|
1 2 3 4 5 6 7 8 9 10 11 12 13 14 15 16 17 |
// Connect CouchbaseEnvironment env = DefaultCouchbaseEnvironment.builder() .tracer(tracer) .build(); Cluster cluster = CouchbaseCluster.create(env, "127.0.0.1"); Bucket bucket = cluster.openBucket("travel-sample"); // Load a couple of docs and write them back for(int i = 0; i < 5; i++) { JsonDocument doc = bucket.get("airline_1" + i); if (doc != null) { bucket.upsert(doc); } } Thread.sleep(TimeUnit.MINUTES.toMillis(1)); |
In this simple code we are reading some docs from the travel-sample bucket and if found write it back with an upsert. This allows us in a simple way to perform both read and write operations. Once the code is run, you will see (similar) output in the logs:
|
1 2 3 4 5 6 7 8 9 10 11 12 13 14 15 16 17 18 19 20 21 22 23 24 25 26 27 28 29 30 31 32 33 34 35 36 37 38 39 40 41 42 43 44 45 46 47 48 49 50 51 52 53 54 55 56 |
Apr 04, 2018 9:42:57 AM com.couchbase.client.core.tracing.ThresholdLogReporter logOverThreshold WARNING: Operations over threshold: [ { "top" : [ { "server_us" : 8, "local_id" : "41837B87B9B1C5D1/000000004746B9AA", "local_address" : "127.0.0.1:55011", "operation_id" : "get:0x6", "dispatch_us" : 315, "remote_address" : "127.0.0.1:11210", "total_us" : 576 }, { "server_us" : 8, "local_id" : "41837B87B9B1C5D1/000000004746B9AA", "local_address" : "127.0.0.1:55011", "operation_id" : "get:0x5", "dispatch_us" : 319, "remote_address" : "127.0.0.1:11210", "total_us" : 599 }, { "server_us" : 8, "local_id" : "41837B87B9B1C5D1/000000004746B9AA", "local_address" : "127.0.0.1:55011", "operation_id" : "get:0x4", "dispatch_us" : 332, "remote_address" : "127.0.0.1:11210", "total_us" : 632 }, { "server_us" : 11, "local_id" : "41837B87B9B1C5D1/000000004746B9AA", "local_address" : "127.0.0.1:55011", "operation_id" : "get:0x3", "dispatch_us" : 392, "remote_address" : "127.0.0.1:11210", "total_us" : 762 }, { "server_us" : 23, "local_id" : "41837B87B9B1C5D1/000000004746B9AA", "local_address" : "127.0.0.1:55011", "operation_id" : "get:0x1", "decode_us" : 9579, "dispatch_us" : 947, "remote_address" : "127.0.0.1:11210", "total_us" : 16533 }, { "server_us" : 56, "encode_us" : 12296, "local_id" : "41837B87B9B1C5D1/000000004746B9AA", "local_address" : "127.0.0.1:55011", "operation_id" : "upsert:0x2", "dispatch_us" : 1280, "remote_address" : "127.0.0.1:11210", "total_us" : 20935 } ], "service" : "kv", "count" : 6 } ] |
This is our threshold log reporter in action! For each service (only kv based on this workload) it will show you the total amount of recorded ops (through count) and give you the top slowest ops sorted by their latency. Since only airline_10 exists in the bucket you see 5 document fetches but only one mutation happening.
Let’s look at one specific operation and discuss each field in a little more detail:
|
1 2 3 4 5 6 7 8 9 10 |
{ "server_us" : 23, "local_id" : "41837B87B9B1C5D1/000000004746B9AA", "local_address" : "127.0.0.1:55011", "operation_id" : "get:0x1", "decode_us" : 1203, "dispatch_us" : 947, "remote_address" : "127.0.0.1:11210", "total_us" : 1525 } |
It tells us the following:
total_us: The total time it took to perform the full operation: here around 1.5 millisecondsserver_us: The server reported that its work performed took 23 microseconds (this does not include network time or time in the buffer before picked up at the cluster)decode_us: Decoding the response took the client 1.2 millisecondsdispatch_us: The time when the client sent the request and got the response took around 1 millisecond.local_address: The local socket used for this operation.remote_address: The remote socket on the server used for this operation. Useful to figure out which node is affected.operation_id: A combination of type of operation and id (in this case the opaque value), useful for diagnosing and troubleshooting in combination with thelocal_id.local_id: With Server 5.5 and later, this id is negotiated with the server and can be used to correlate logging information on both sides in a simpler fashion.
Note that the exact format of this log is still a bit in flux and will change between dp1 and beta / GA releases.
You can see that if the thresholds are set the right way based on production requirements, without much effort slow operations can be logged and pinpointed more easily than before.
There is one missing piece to the puzzle though which we are going to cover next: how this relates to the dreaded TimeoutException.
Timeout Visibility
Previously, when an operation takes longer than the timeout specified allows, a TimeoutException is thrown. It usually looks like this:
|
1 2 3 4 5 6 |
Exception in thread "main" java.lang.RuntimeException: java.util.concurrent.TimeoutException at com.couchbase.client.java.util.Blocking.blockForSingle(Blocking.java:77) at com.couchbase.client.java.CouchbaseBucket.get(CouchbaseBucket.java:131) at Main.main(Main.java:34) Caused by: java.util.concurrent.TimeoutException ... 3 more |
Looking at this stack trace you can infer a couple of things, for example that the timed out operation was a GetRequest. If at runtime you need more information, you used to have to wrap it based on your own context. For example:
|
1 2 3 4 5 6 7 |
try { bucket.get("foo", 1, TimeUnit.MICROSECONDS); } catch (RuntimeException ex) { if (ex.getCause() instanceof TimeoutException) { throw new RuntimeException(new TimeoutException("id: foo, timeout: 1ms")); } } |
This is very tedious and still doesn’t give you insight into the internal behavior as needed.
To remedy this situation, the new client does (roughly) the above thing for you transparently but adds even more information without having to do a thing. The same timeout in the new SDK will look like the following:
|
1 2 3 4 5 6 7 8 9 10 |
Exception in thread "main" java.lang.RuntimeException: java.util.concurrent.TimeoutException: localId: 2C12AAA6637FB4FF/00000000147B092F, opId: 0x1, local: 127.0.0.1:60389, remote: 127.0.0.1:11210, timeout: 1000us at rx.exceptions.Exceptions.propagate(Exceptions.java:57) at rx.observables.BlockingObservable.blockForSingle(BlockingObservable.java:463) at rx.observables.BlockingObservable.singleOrDefault(BlockingObservable.java:372) at com.couchbase.client.java.CouchbaseBucket.get(CouchbaseBucket.java:131) at SimpleReadWrite.main(SimpleReadWrite.java:64) Caused by: java.util.concurrent.TimeoutException: localId: 2C12AAA6637FB4FF/00000000147B092F, opId: 0x1, local: 127.0.0.1:60389, remote: 127.0.0.1:11210, timeout: 1000us at com.couchbase.client.java.bucket.api.Utils$1.call(Utils.java:75) at com.couchbase.client.java.bucket.api.Utils$1.call(Utils.java:71) *snip* |
You might recall some of the fields from the log description above, and that’s intended. Now the timeout itself provides you valuable information like the local and remote sockets, the operation id as well as the timeout set and the local ID used for troubleshooting. Without extra effort you can take this information and correlate it to the top slow operations in the threshold log.
The TimeoutException now provides you more information into “what” went wrong and then you can go look at the log to figure out “why” it was slow.
Swapping out the Tracer
Finally, there is one more feature baked into this. As mentioned earlier, the new opentracing-api comes bundled for a reason. It only provides an interface description, but this is enough to open all these metrics and stats to a whole universe of OpenTracing compatible tracer implementations. You can pick one of the open source available ones like jaeger, use one provided by APM vendors or even write your own one. The key point here is that the SDK uses an open, standardized interface which you can plug other things into while including a useful, basic Tracer.
As an example, here is how you can swap in our default tracer with one from jaeger:
|
1 2 3 4 5 6 7 8 9 10 |
Tracer tracer = new Configuration( "my_app", new Configuration.SamplerConfiguration("const", 1), new Configuration.ReporterConfiguration( true, "localhost", 5775, 1000, 10000) ).getTracer(); CouchbaseEnvironment env = DefaultCouchbaseEnvironment.builder() .tracer(tracer) .build(); |
Without any changes to the actual app, all the traces and spans will now be fed into a distributed tracing engine where you have nice UIs to visualize the behaviour of your application landscape.
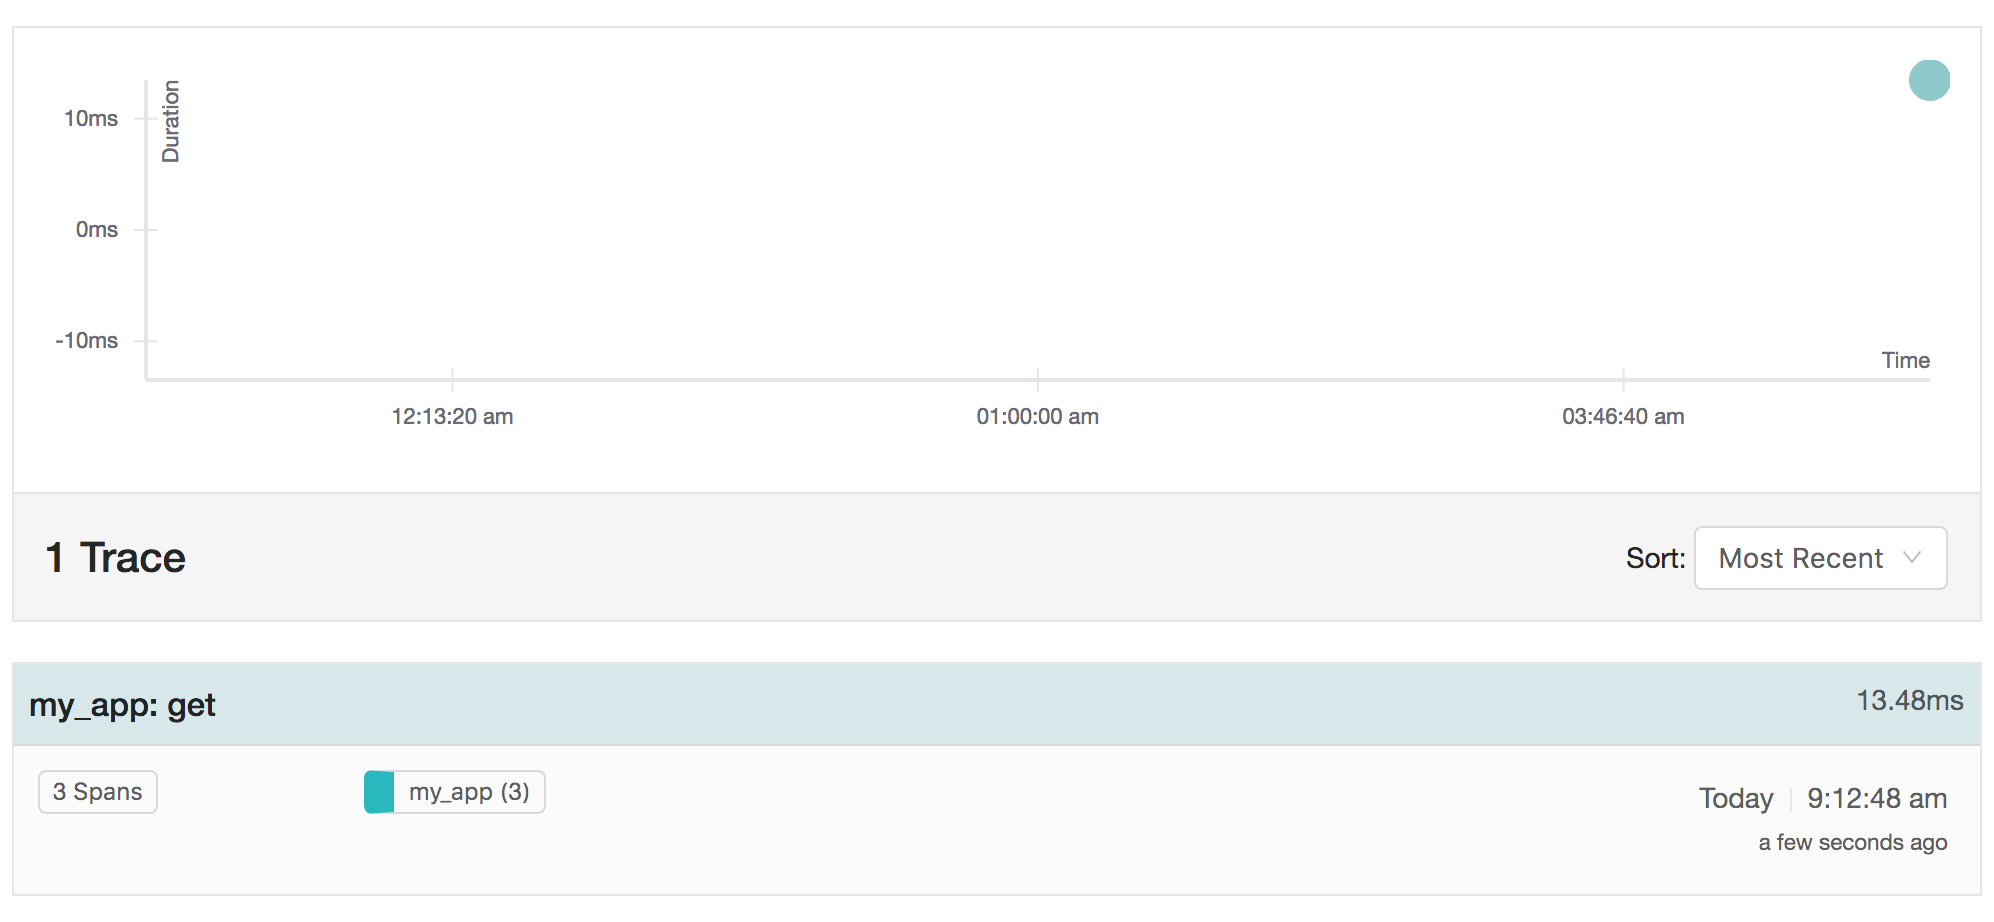
A get operation as in the sample above can look like this in the jaeger overview page:
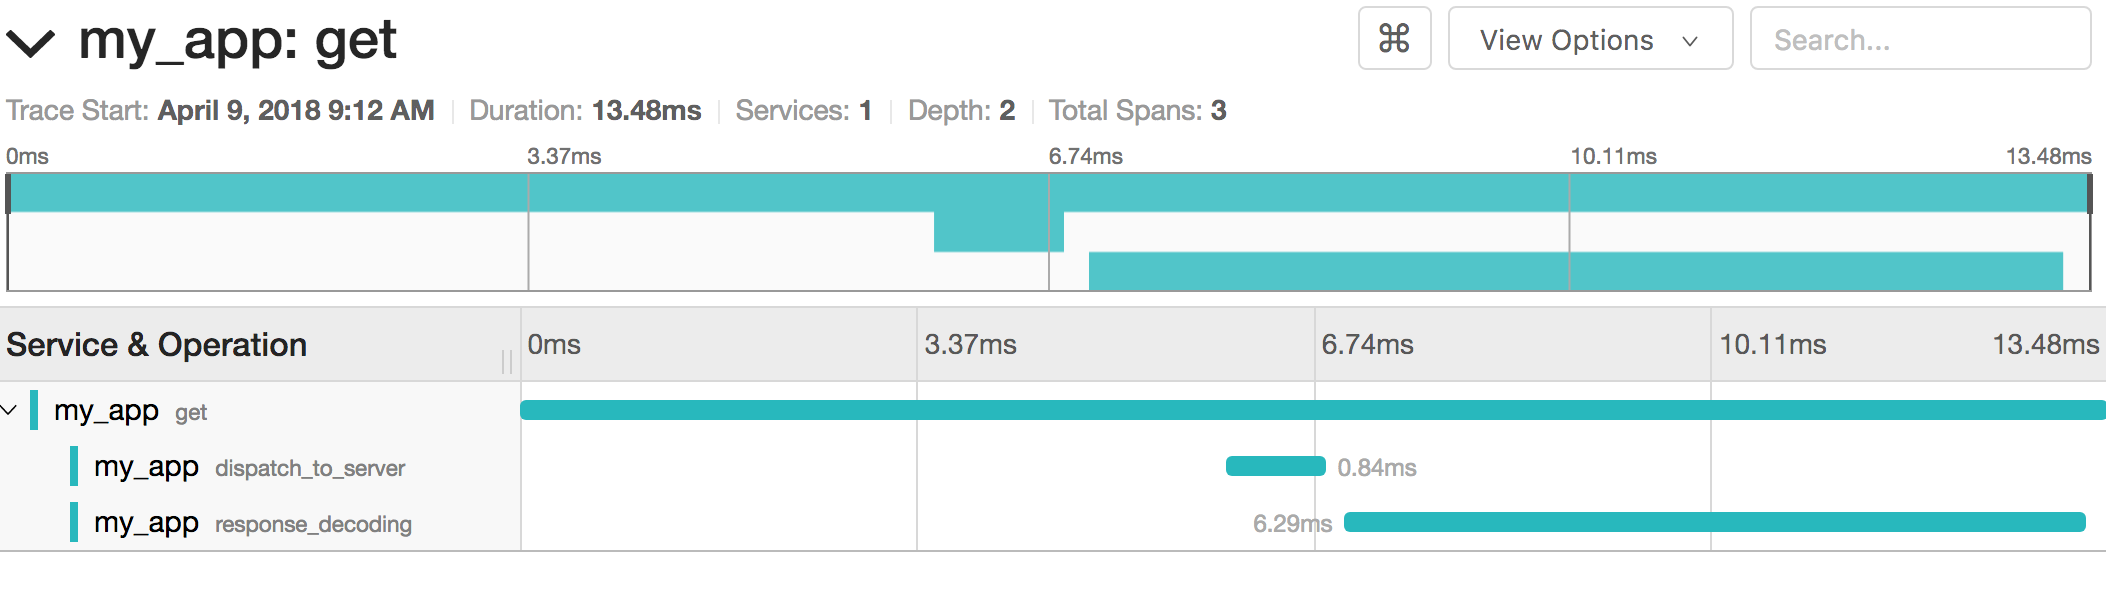
Drilling into the specific trace, the individual span and sub-span timings become visible:
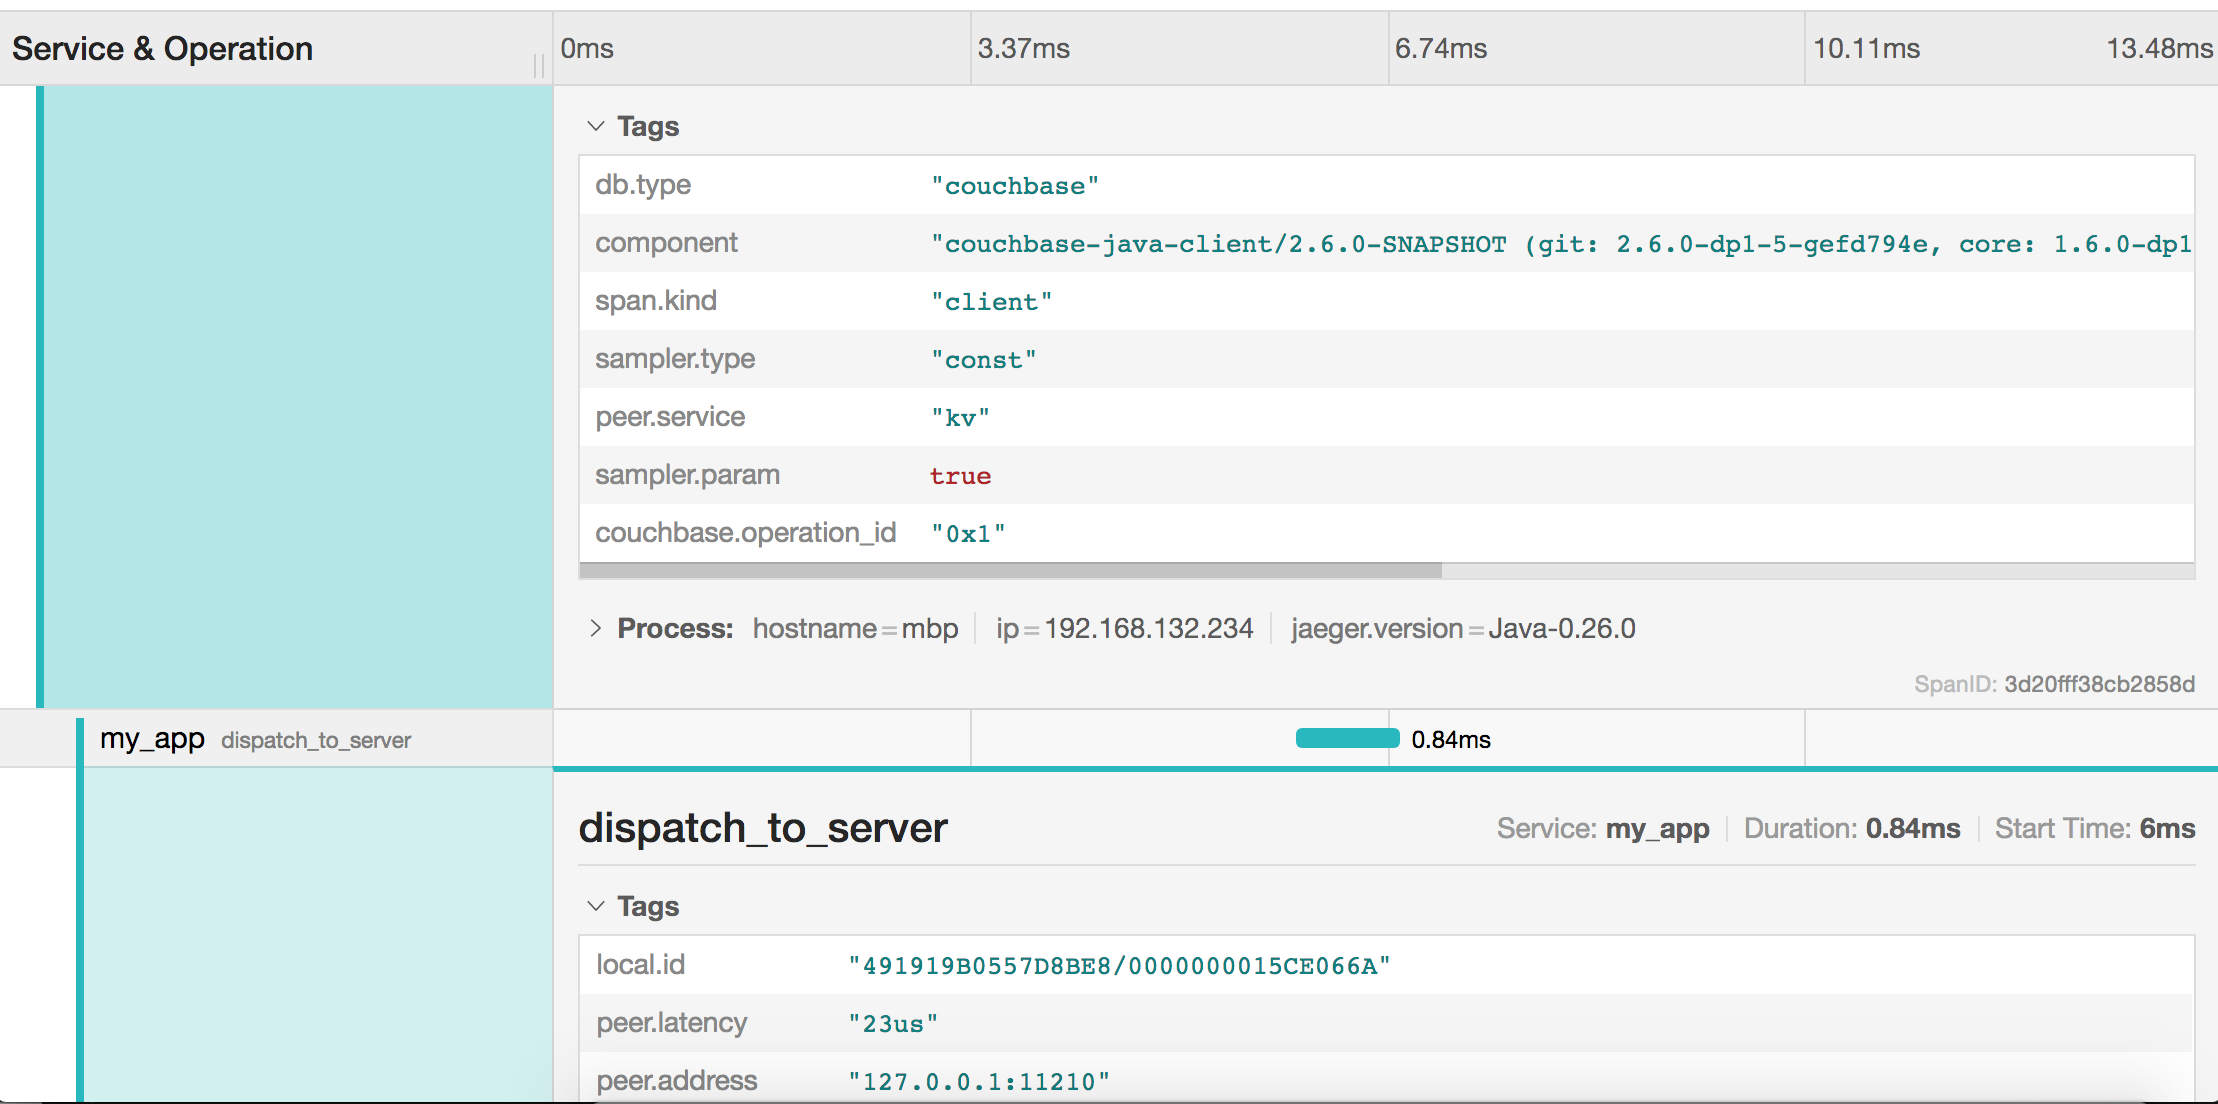
Each span also contains tags that the SDK attaches for advanced filtering and analysis:
Summary
Enhancing our SDKs with Response Time Observability we are now able to provide deeper insight into what and why something is not working/performing as expected. Relying on OpenTracing as the interface, in addition we can make it vendor-agnostic and open the possibility of plugging in one’s compatible APM/tracing tool of choice if there is a need for it.