Data scientists love Jupyter Notebooks – and it makes a natural pairing with the Couchbase document database.

Why? The Jupyter Notebook web application lets you create and share documents that contain narrative text, equations and the like for use cases such as data visualization and machine learning. Couchbase lets you store and process vast amounts of data (semi-structured and unstructured) at scale and support the kinds of data the world is full of: narrative text (social media posts, etc.), equations and more.
In this post, you’ll learn how to establish connectivity between a Couchbase cluster and a Jupyter Notebook, then pull data from Couchbase and use it to train a linear regression model for machine learning. We’ll walk through an example to predict a target variable’s value using categorical variables via a linear regression equation.
Loading Your Data
To kick things off, proceed through these steps to load the sample dataset:
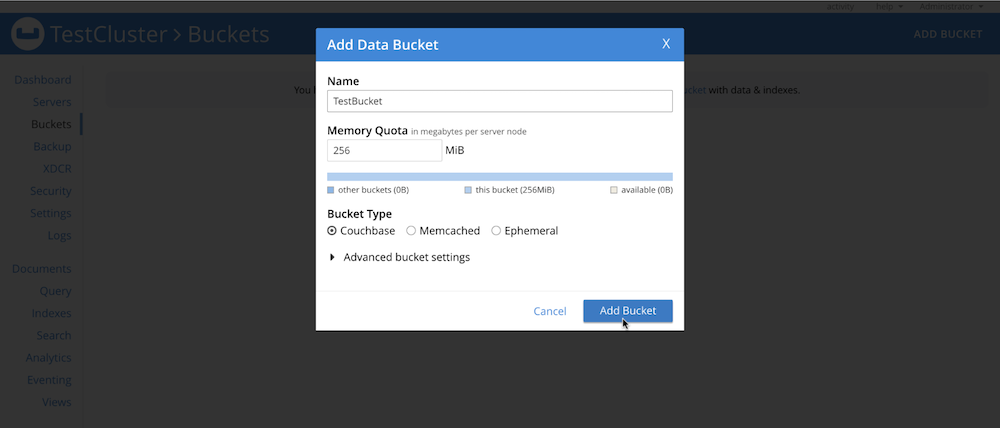
- In the Couchbase cluster’s Admin Console, go to Buckets > Add Bucket to create a new bucket, as shown here:
-
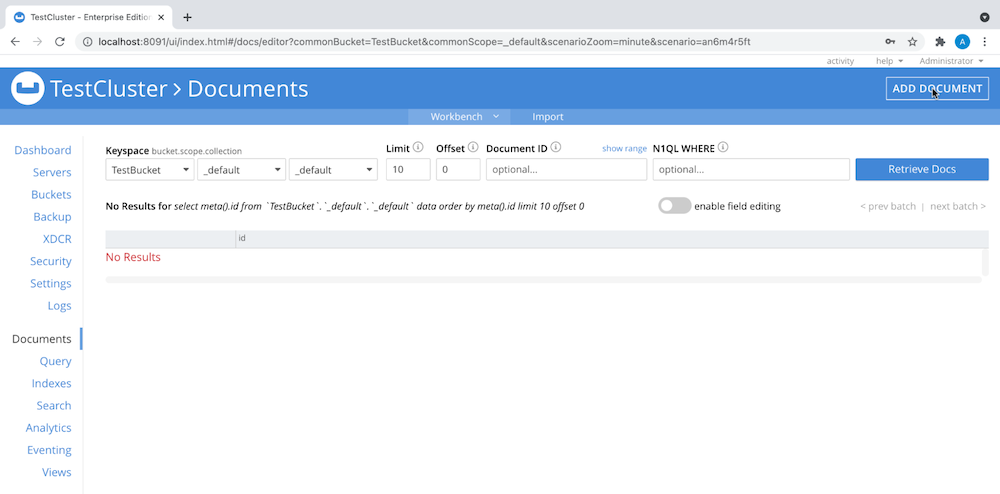
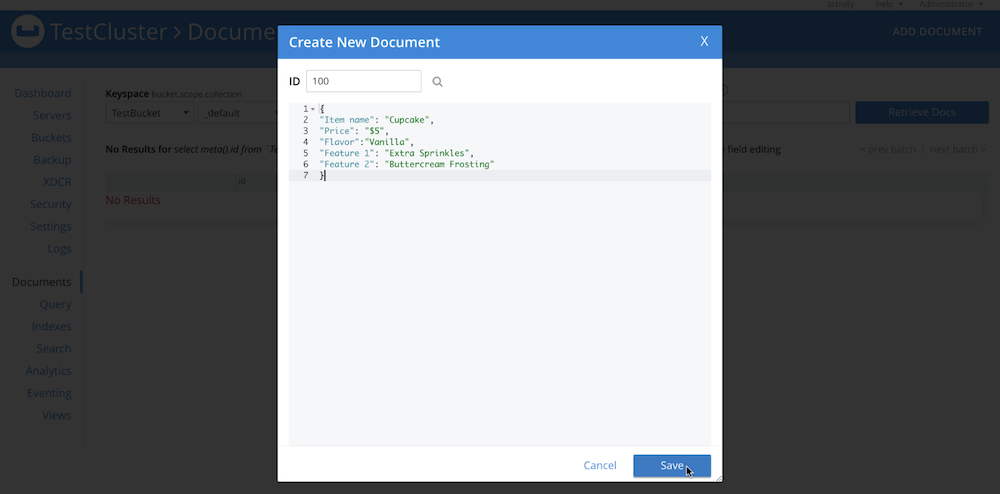
Add documents to your bucket by either navigating to Documents > Add Document, like this:
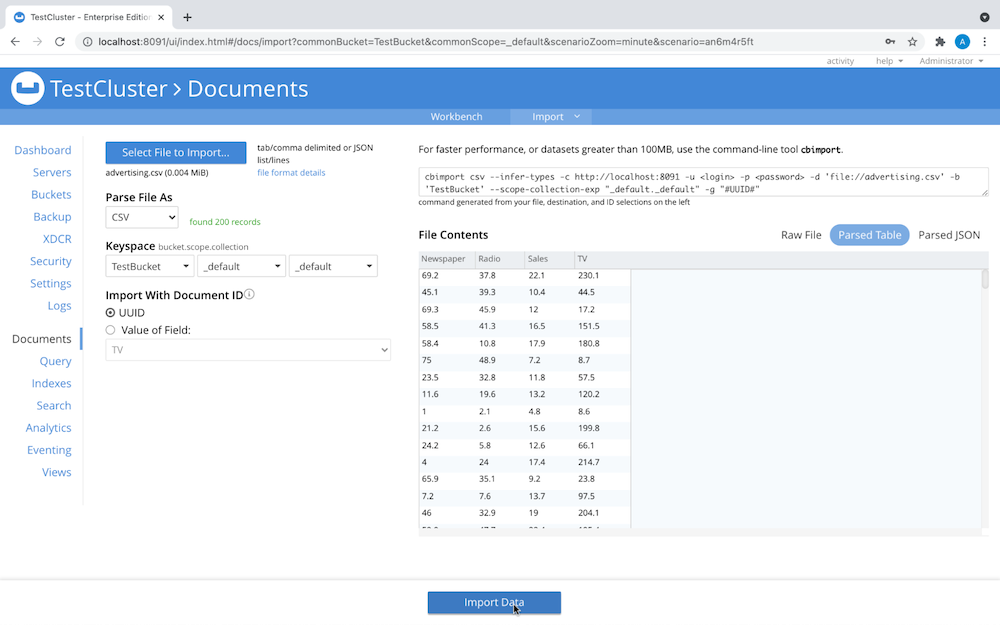
or uploading a list of JSON documents or a CSV file. For this example we’ll upload a CSV file using
cbimport. Here’s what my document looks like: - The file can be any data you want to work on. This example uses the Advertising Dataset from Kaggle.
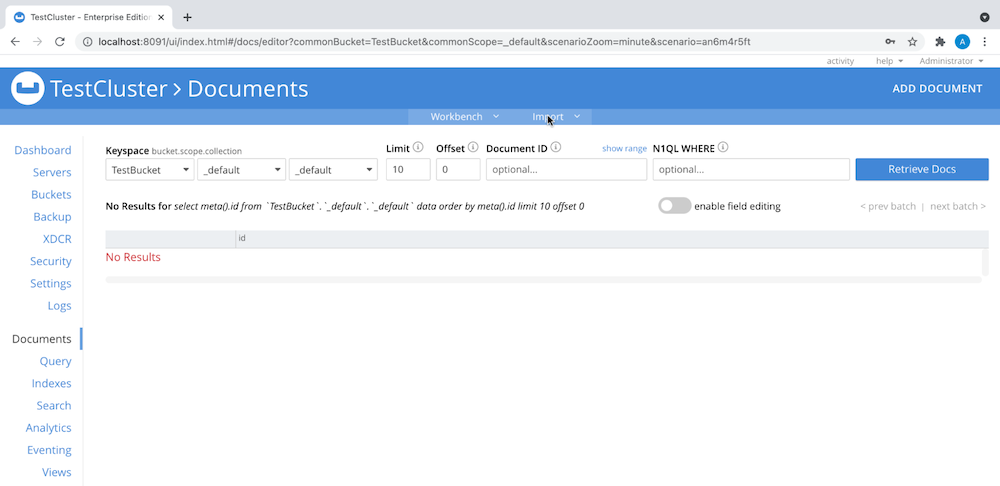
- Go to Documents > Import, as shown here:
-
Select the file you wish to import and the data bucket where the documents reside:
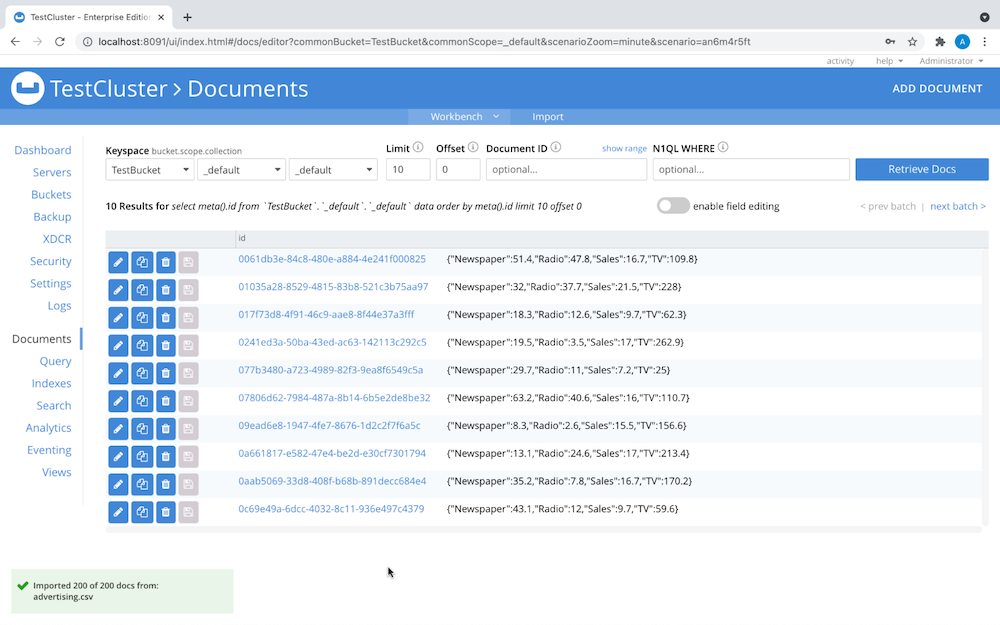
Your Documents menu should now look something like this:
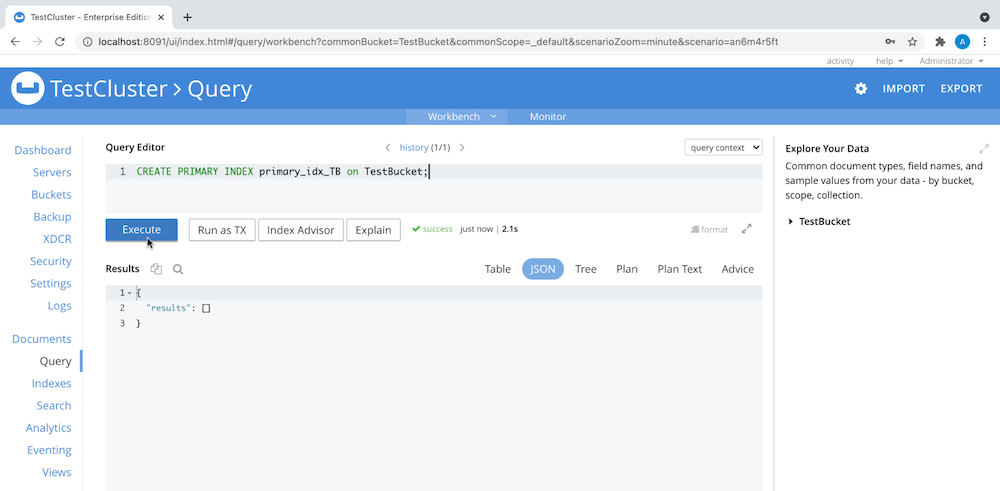
- In the Admin Console, create a primary index for the data bucket to make the data queryable, as you see here:
Installing the Jupyter Notebook
First off, download the couchbase-jupyter-example from the Couchbase Labs GitHub repo. Then follow these steps:
- Install Jupyter Notebook via either the Python package management system (
pip) or Anaconda. - Install the dependencies for this project by using
pipfrom therequirementsfile in your shell:
1$ pip install -r requirements.txt - Open Jupyter Notebook from the shell.
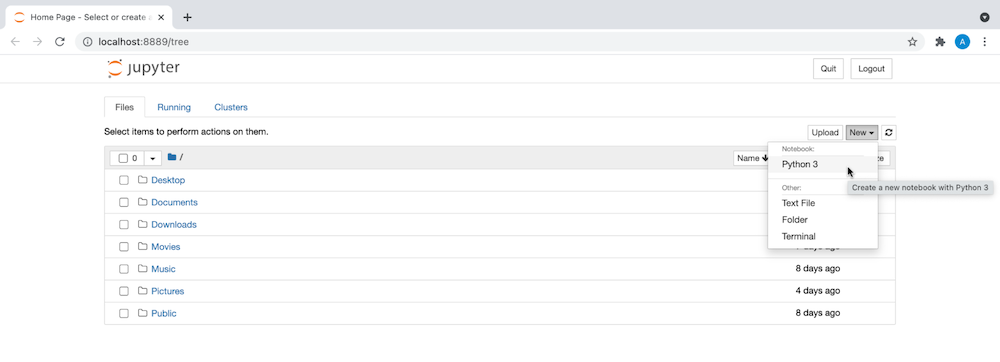
- Create a new notebook with Python 3, as shown here:
What Is a Linear Regression Model?
The linear regression model is powerful for predictive analysis, letting us determine the strength of categorical or independent variables and forecasting the effect of those variables and identifying trends in the data.
As you might deduce from the name linear regression, the “curve” we use to fit the data is a line. The simplest form of the regression equation is y = mx + c, where y represents the target variable, x represents a single categorical variable and m and c are constants. We will use a simple linear regression equation in our example.
The categorical variables in our example are TV, Radio and Newspaper. The target variable is Sales.
Training Our Linear Regression Model
- In the new Jupyter Notebook, use the code shown below to connect to the Couchbase server. Use your username and password, of course, instead of
Administratorand123456.

- Import the required libraries, shown in the screenshot here. If these libraries aren’t present in your environment, download the latest versions of these libraries to the right environment using the Python package manager,
pip.

- Using the
SELECTcommand, fetch the data from your data bucket into a pandas data frame:

- You can view the contents of your pandas data frame using the
describe()command, as shown here:

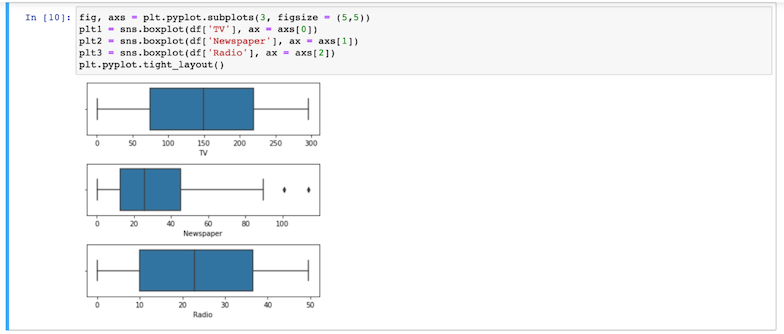
- Create boxplots corresponding to the values of each categorical variable to detect outliers:
- Create scatter plots for each categorical variable against the target variable to determine the degree of correlation.
Notice thatTVappears to have the highest degree of correlation.

- Split the dataset, using 60% of it for training and the remaining 40% for testing. We can now determine the value of coefficients in the regression equation, when the categorical variable is
TVand the target variable isSales, using the Ordinary Least Squares method.
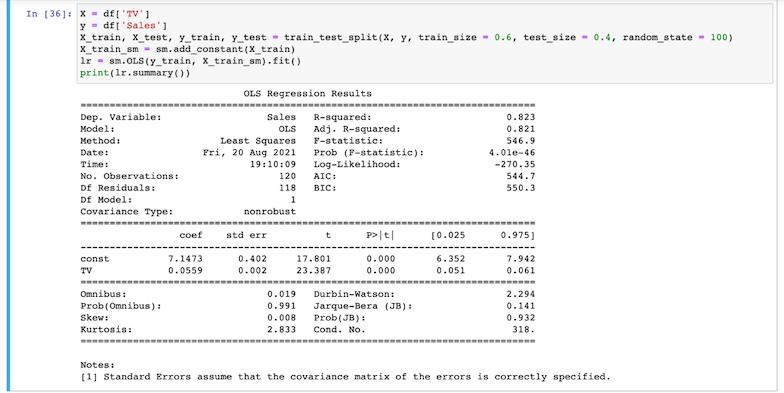
- Now train the model using the code you see here:
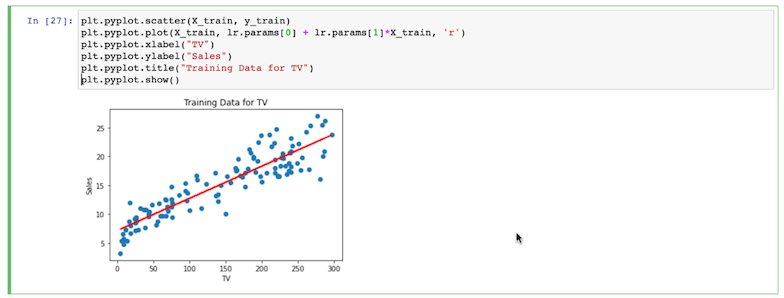
- Next, substitute
testfortrainto use the model to predict the test set’s values, like this:
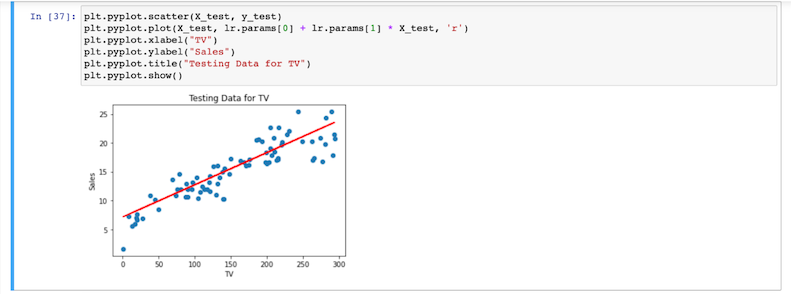
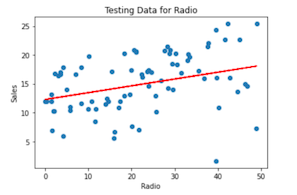
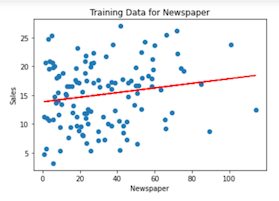
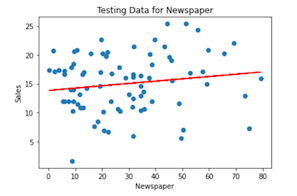
Using the same approach, we can train and test a model with the categorical variables Radio and Newspaper, as well:

Going Further with Machine Learning & Couchbase
Now that you’ve gotten your feet wet with connecting Couchbase Server to Jupyter Notebook and explored the machine learning concept of linear regression, build on that knowledge with these posts on how to use Couchbase as a machine learning model store and enabling AI-driven insights using Couchbase.

