
This blog is co-authored by Karen Yuan, a High School Intern
In our previous article, we learned to do exploratory data analysis using the Couchbase Query service. We also learned to efficiently read training data with the Query APIs in the Couchbase Python SDK and seamlessly save it to a pandas dataframe suitable for machine learning (ML). And finally, we stored ML models and their metadata in Couchbase. In this article, we will learn how to make predictions, store them in Couchbase and use the Query charts to analyze them.
Real-Time Prediction
The data scientist uses the trained model to generate predictions.
We will use the prediction flow in Figure 1 to predict the churn score in real-time and store the prediction in Couchbase. We will use the churn prediction model we trained in the previous article.
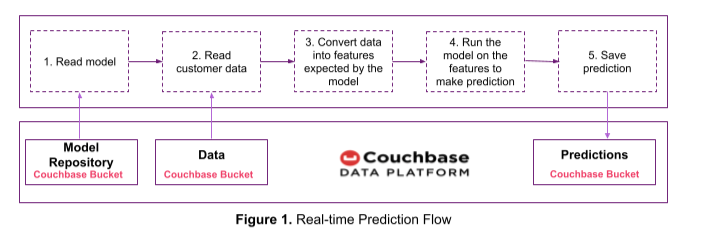
Function to read model and its metadata stored on Couchbase:
|
1 2 3 4 5 6 7 |
def read_model_from_couchbase(model_id): bucket = cluster.bucket('model_repository') model_bytes = bucket.get(model_id).value model = pickle.loads(model_bytes) key = model_id + "_metadata" feature_names = bucket.get(key).value['feature_names'] return {'model': model, 'feature_names': set(feature_names)} |
Function to read customer data stored on Couchbase:
|
1 2 3 4 5 6 7 8 9 10 11 12 13 14 15 16 |
# We will use the Query interface in the Couchbase Python SDK to get multiple customer # records that satisfy a condition. Alternatively, the GET interface in the Couchbase Python SDK can # be used to get individual customer records e.g. bucket.get(customer_key).value def read_data_from_couchbase(select_clause = "", where_clause = ""): if select_clause: query_statement = "SELECT customer.*, " + select_clause else: query_statement = "SELECT customer.*" query_statement = query_statement + " FROM `online_streaming` as customer" if where_clause: query_statement = query_statement + " WHERE " + where_clause # Use the Query API to get customer records query_result = cb.query(query_statement) return pd.DataFrame.from_dict(list(query_result)) |
The following predict function reads the model, its metadata and customer records using the above functions. It converts the customer data into features using the same process as the one used during training (i.e., one-hot encoding). It then predicts the churn score by running the model on the features.
|
1 2 3 4 5 6 7 8 9 10 11 12 13 14 15 16 17 18 19 |
def predict(model_id, select_clause = "", where_clause = ""): # Step 1: Read the model and its metadata from Couchbase rv = read_model_from_couchbase(model_id) model = rv['model'] feature_names = rv['feature_names'] # Step 2: Read customer records from Couchbase df = read_data_from_couchbase(select_clause, where_clause) customer_prediction = df # Step 3: Convert the raw data into features expected by the model df = pd.get_dummies(df) drop_cols = set(list(df.columns)) - feature_names df.drop(drop_cols, axis = 1, inplace = True) df = df.reindex(columns=feature_names, fill_value=0) # Step 4: Predict prediction = model.predict(df) customer_prediction['Churn Prediction'] = prediction return customer_prediction |
|
1 2 3 |
# Example: Predict churn for a customer with given ID prediction = predict('churn_predictor_model_v1', where_clause = "customer.CustomerID = 100002")[['CustomerID', 'Churn Prediction']] prediction |
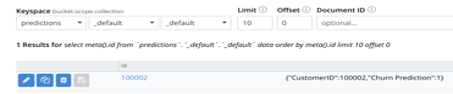
Churn prediction for customerID 100002 is 1. This indicates that they are likely to leave the streaming service.
![]()
The prediction is saved in a Couchbase bucket called predictions using the code shown below. Create the predictions bucket on your Couchbase cluster before proceeding.
|
1 2 3 4 |
bucket = cluster.bucket('predictions') to_save = prediction.to_dict(orient="records")[0] key = str(prediction.iloc[0]['CustomerID']) bucket.upsert(key, to_save) |
Verify that the prediction was successfully saved in Couchbase.
You can also run the trained model and generate predictions in Couchbase Analytics using the Python UDF feature (currently in developer preview). Refer to the article on running ML models using Couchbase Analytics Python UDF for more information.
What-if Analysis
The data scientist will analyze the predictions to answer questions that help make decisions.
The problem we defined in the previous article was a sales team at the online streaming service company wanting to know whether increasing the monthly cost will maximize the revenue while keeping the customer churn in check.
To answer this, we will use the code below to predict the churn scores when the monthly costs are increased by $1, $2, etc. Results of this analysis will be stored in the predictions bucket.
Using the Couchbase cluster UI, create a scope called what_if_analysis and collection called increase_monthly_cost in the predictions bucket. (Scopes and collections are available in Couchbase Server 7.0 and later)
|
1 2 3 4 5 6 7 8 9 10 11 12 13 14 15 16 17 18 19 20 21 22 23 24 25 26 27 28 29 30 31 |
# Connect to predictions bucket on Couchbase and relevant scope and collection bucket = cluster.bucket('predictions') wa_scope = bucket.scope("what_if_analysis") wa_collection = wa_scope.collection("increase_monthly_cost") # Predict the churn rate if the monthly cost of existing customers is increased by # $1, $2 .. $5 for increase_by in range (1, 6): # where_cluase is set to customer.Churn = 0 because we are interested # only in existing customers # The following select_clause will update the MonthlyCost as shown while returning the # query result. In each iteration of this loop the MonthlyCost will increase by $1, $2 ... select_clause = "customer.`MonthlyCost` + " + str(increase_by) + " as `MonthlyCost`" # The updated MonthlyCost is passed as input along with other attributes to the prediction # function. The output tells which of the existing customers are likely to # to churn if the MonthlyCost is increased by the specified amount. rv = predict('churn_predictor_model_v1', select_clause = select_clause, where_clause = "customer.Churn = 0") # Monthly revenues are predicted by adding the monthly cost of the customers not likely to churn. rv['Predicted Monthly Revenue'] = (1 - rv['Churn Prediction']) * rv['MonthlyCost'] predicted_churn_rate = rv['Churn Prediction'].value_counts(normalize=True).mul(100)[1] # Save predictions to Couchbase. to_save = {'Monthly Cost Increase ($)': increase_by, 'Predicted Monthly Revenue': rv['Predicted Monthly Revenue'].sum(), 'Predicted Churn Rate': predicted_churn_rate} key = "increase_by_$" + str(increase_by) wa_collection.upsert(key, to_save) # Use the Query API to calculate current revenue. Store it also on the predictions bucket. This is # used for comparison current = cb.query('SELECT sum(customer.`MonthlyCost`) as CurrentRevenue FROM `online_streaming` customer where customer.Churn = 0') to_save = {'Monthly Cost Increase ($)': 0, 'Predicted Monthly Revenue': list(current)[0]['CurrentRevenue'], 'Predicted Churn Rate': 0} wa_collection.upsert("current", to_save) |
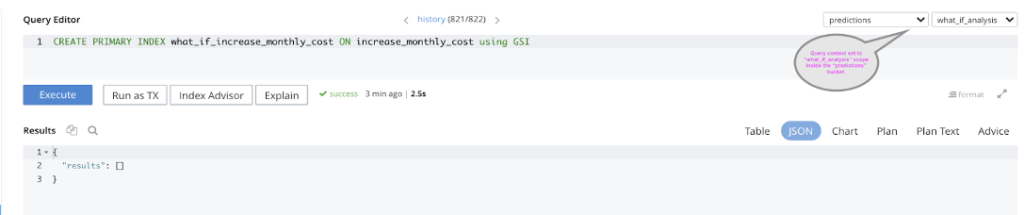
To analyze the prediction results using Couchbase Query, create a primary index on the what_if_analysis scope as shown in the Query UI below. Note that the query context should be set as shown.
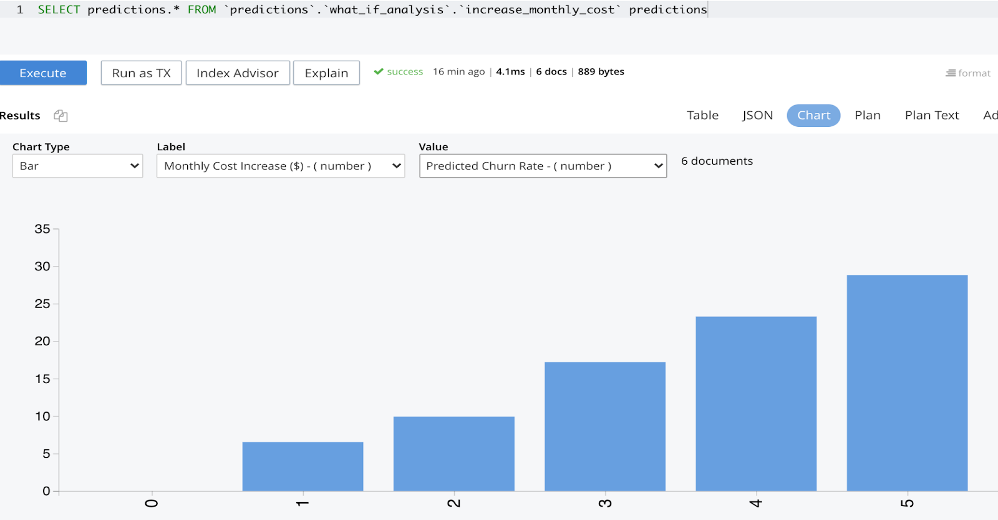
Query charts can be used to analyze the prediction results. The chart below shows that ~7% of existing customers are predicted to churn if their monthly cost is increased by $1, ~10% will likely churn if the monthly cost is increased by $2, etc.
The chart below shows that the current monthly revenue is $3.15 million. This revenue is predicted to increase by ~$50K if the monthly subscription cost of existing customers is increased by $1 and by ~$230k if the monthly cost is increased by $2. But the revenue is predicted to dip if the monthly cost is increased by $3 or more because of the higher predicted churn rate.
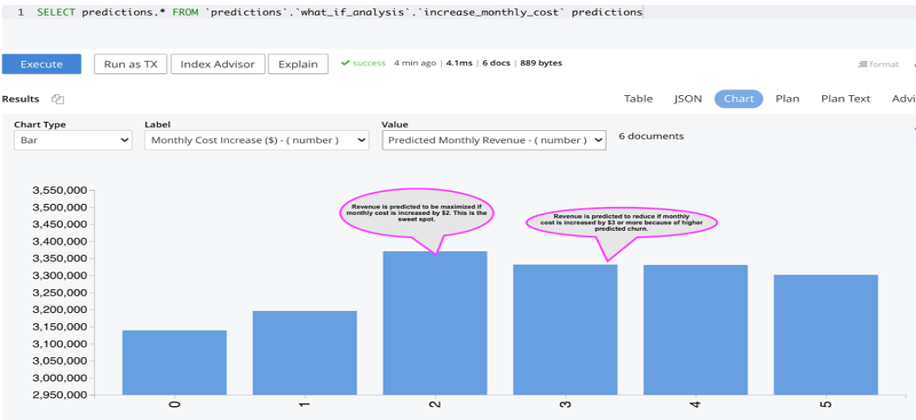
Using this analysis, we can conclude that the sales team at the online streaming service company can increase the monthly subscription cost by $2 to maximize the revenue while keeping the churn rate in check.
The “Download chart” option in the Query UI can be used to save the charts.
Couchbase Analytics Service
We used the Couchbase Query API in the Python SDK to read data from Couchbase. If you want to use the Couchbase Analytics API instead, then here is an example to read the data from Couchbase and store it in a pandas dataframe.
|
1 2 |
analytics_result = cb.analytics_query("SELECT customer.* FROM online_streaming customer") analytics_raw_data = pd.DataFrame(analytics_result) |
The Couchbase Analytics service can also be used for EDA, data visualization and to run trained ML models (developer preview). Refer to the N1QL for Analytics Language Reference and the article on running ML models using Couchbase Analytics Python UDF for more information.
Conclusion
In this and the previous article, we learned how Couchbase makes data science easy. Using customer churn prediction as an example, we saw how to perform exploratory analysis using the Query service, how to efficiently read big training datasets using the Python SDK and easily store it in a data structure suitable for ML.
We also saw how to store ML models, their metadata and predictions in Couchbase and how to use the Query charts for analyzing predictions.
The Couchbase Data Platform can be used to store raw data, features, ML models, their metadata and predictions on the same cluster as the one running Query and Analytics services. This makes the process fast and easy by reducing the number of tools needed for data science.
Next Steps
If you’re interested in learning more about machine learning and Couchbase, here are some great next steps and resources to get you started:
- Start your free trial of Couchbase Cloud – no installation required.
- Couchbase Under the Hood: An Architectural Overview – dive deeper into the technical details with this white paper.
- Explore the Couchbase Query, Full-Text Search, Eventing, and Analytics services.
- Check out these ML blogs: