
Note: This post uses the the Couchbase Analytics Data Definition Language as of the version 5.5 preview release. For updates and information on breaking changes in newer versions, please refer to Changes to the Couchbase Analytics Service.
Data visualization and reporting can help decision makers to identify patterns and concepts in analytics. Couchbase Analytics (currently in developer preview) provides a seamless NoETL experience (video) to analyze data with powerful queries. Knowi is a cloud-based reporting and visualization tool that integrates with Couchbase. These tools can work together to provide powerful and easy data visualization.
As I blogged about previously, the Cincinnati Reds (a Couchbase customer) are using Apache NiFi to process data from their enterprise into a Couchbase Cluster. One of the many use cases they are exploring with Couchbase is to create a real-time dashboard. This dashboard would, among other things, show a data visualization of the ballpark after the gates open and tickets are starting to be scanned.
This real-time data visualization can help show patterns at the ballpark, and give the Reds an idea of when ticket holders are showing up and where they are going.
In this blog post, I’m going to show you an example of Couchbase and Knowi in action to provide a data visualization of Great American Ball Park (where the Cincinnati Reds play their home games). What I’m showing in this post is not exactly what the Reds are using: it has been simplified.
Data in Couchbase
The Reds have a sophisticated mapping system to match a section, row, and seat number to a specific spot on a map graphic. For this blog post, however, I’m going to use latitude and longitude with Google Maps.
The data I’m working with is a simplified document consisting of a ticket holder’s name, geo-coordinates, and a type field. An example document:
|
1 2 3 4 5 6 7 8 |
{ "name": "Sparky Anderson", "geo": { "lat": 39.097303, "lon": -84.507277 }, "type": "ticketScan" } |
I would normally expect mapping data to be separate, and possibly joined on-the-fly with a ticket scan. But let’s assume that’s been done already. We have all we need in a single document.
I’ve created a bucket called “tickets” which will contain documents like the above. In production, data will continually flow into this bucket (probably through NiFi) during a baseball game. In fact, I recently attended a game and helped test this system as I was walking through the gates and getting my ticket scanned during peak times at a weekend game.
Couchbase Analytics
Knowi could connect to this bucket directly and start reporting on it. However, it might be better to use Couchbase Analytics in this situation. Using Couchbase Analytics means we don’t have to worry about writing indexes for more complex queries, and it also means we will reduce any performance impact on the operational bucket.
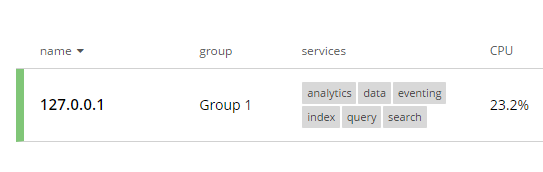
To get started with Couchbase Analytics, make sure you’ve enabled the Analytics service when you installed Couchbase. The analytics service should appear in the “Servers” tab:
Next, go to the “Analytics” tab. You will see a screen that looks very similar to the normal N1QL Query Workbench.
Setting up analytics
There are three simple steps for getting started.
First, create an analytics bucket. This bucket will correspond to a regular Couchbase bucket. Simply enter a command like this: CREATE BUCKET ticketsAnalytics WITH {"name":"tickets"};
Next, define a dataset from within that bucket. You can specify which documents that should go into that dataset by using a WHERE clause. Example:
|
1 |
CREATE SHADOW DATASET ticketScans ON ticketsAnalytics WHERE `type` = "ticketScan"; |
This is a “shadow”: a real-time copy of (a subset of) a Couchbase bucket.
Finally, kick off the shadowing with one more command: CONNECT BUCKET ticketsAnalytics;
At this point, ticketScan documents from the Couchbase bucket “tickets” will start to be copied over into the Analytics bucket “ticketsAnalytics”.
It will start happening immediately. You can run a query like select * from ticketScans; to see the data in Analytics.
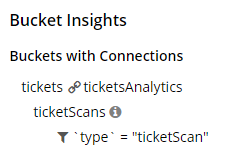
You should also see a visual representation of this setup under “Bucket Insights” at the top right of the page.
Note that Analytics is still in developer preview at this time, and the above steps may change after general release (currently planned for later this year).
Setting up the Knowi Agent (optional)
You can create a free 14-day trial of Knowi.
Knowi is cloud-based, so you don’t necessarily need to download anything. You can build reports and visualizations right in your browser.
However, if your Couchbase cluster isn’t exposed to the internet, or you don’t have a VPN tunnel set up, you can still use Knowi by running the Knowi Agent on your network. This is an easy way for Knowi to get access to your data. My local Couchbase cluster is not exposed to the internet, so I simply downloaded the Knowi Agent:
You’ll need to create a datasource JSON file in the /config folder. This is really easy to do, because there are a ton of example files in the /example folder. For Couchbase, check out datasource_example_couchbase.json. For my local cluster, I created a file with these contents:
|
1 2 3 4 5 6 7 8 9 |
[ { "name": "demoCouchbase", "host": "localhost", "dbName": "matt", "password": "password", "datasource": "couchbase" } ] |
This assumed you created a user named “matt” in Couchbase with permission to use Analytics.
The Agent comes with some handy shell scripts and batch files. It can run as a service, or you can just do what I did and run run.bat to kick off the agent. At this point, Knowi will be able to communicate with your Couchbase cluster through the agent.
Setting up a data source in Knowi
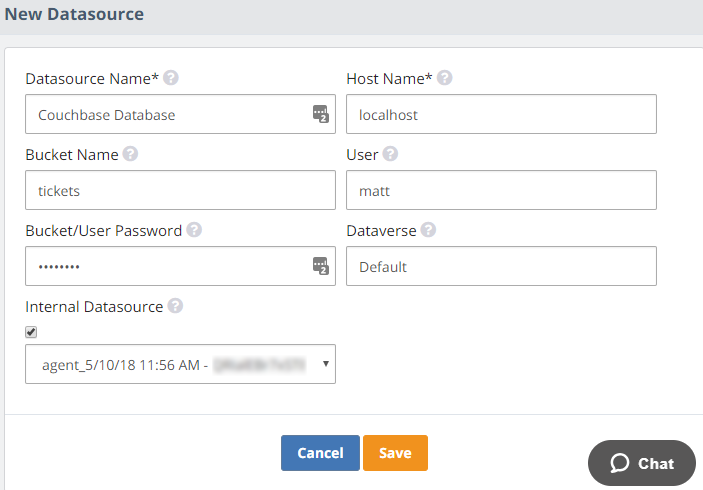
Now go back to the Knowi.com UI. Create a new datasource. You can give it whatever name you’d like. If you’re using the agent like me, set “localhost” to be the data source. I also specified a bucket name of “tickets”. I entered the user credentials. For Analytics, you need to specify a “Dataverse”. Out of the box, there is already a “Default” dataverse available.
Finally, check the box for “Internal Datasource”. If the agent is working properly, you will see a dropdown and be able to select the agent. If you aren’t using an Agent, then don’t check that box.
At this point, you can use this data source to create 1 or more Knowi data feeds.
Knowi Data Feeds
A data feed / data set in Knowi is analogous to a query. Here is the (very simple) data feed that I created to get the ticket information from Couchbase.
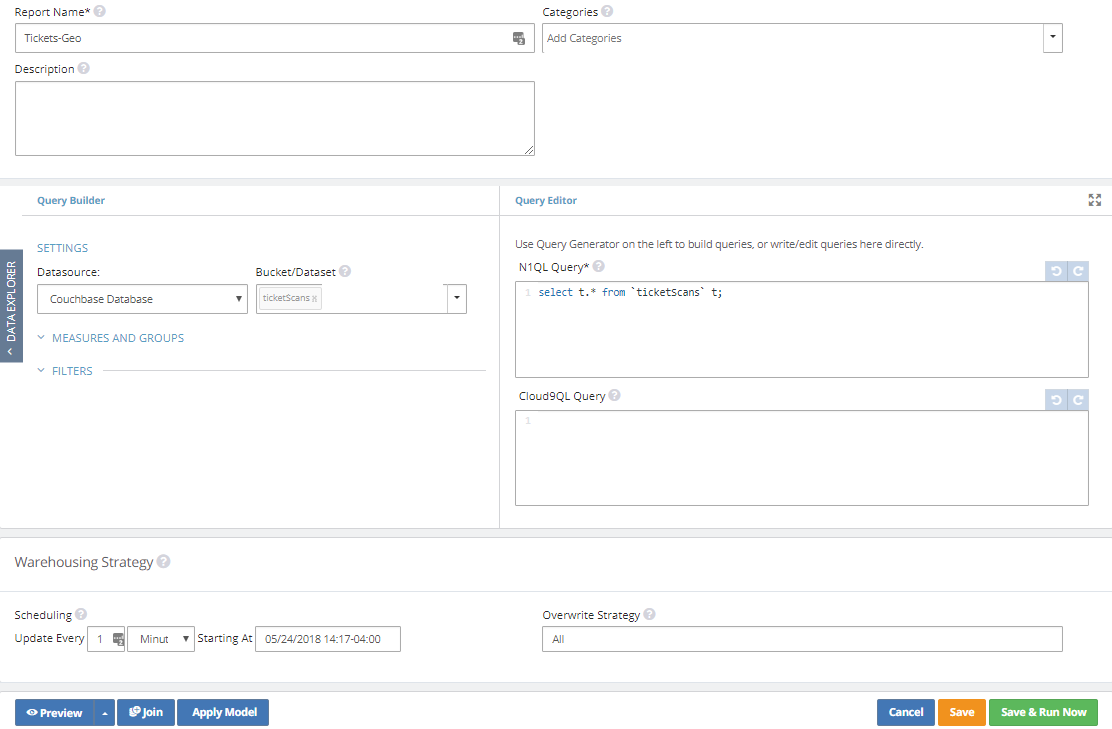
Notice that Knowi supports N1QL natively. All the power of Couchbase’s N1QL language is available to you when creating a data feed. My query is a very simple one just for demonstration.
Knowi widget
Finally, I can create a Knowi widget. Widgets are individual reports or data visualizations. There are a variety of widgets available, and you can even customize and combine widgets. I’m going to keep it simple and create a single widget. Click “New Widget+” and then select the data set that you created in the previous section.
Next, click the “settings” cog next to the widget. There are a lot of options for reporting and data visualization. Definitely check them out and experiment with them. I’m going right for “Geo-Heatmaps”.
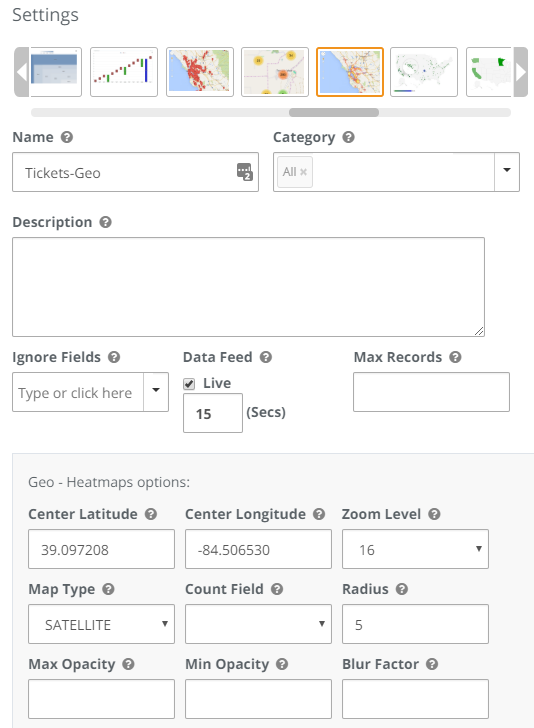
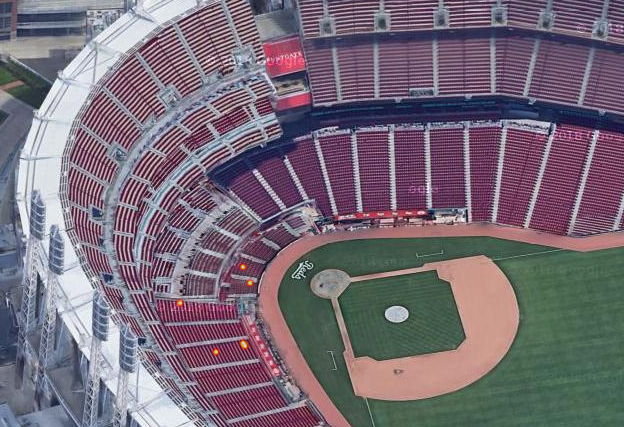
I’ve chosen the middle of Great American Ball Park for the Center Latitude and Center Longitude (39.097208,-84.506530) and a high zoom level. The radius represents how big you want the spots on the heatmap to be. Mine correspond to seats in a baseball stadium, so I’ve entered a relatively small value of 5.
That’s it. Save the widget. Click the eyeball icon to see a preview. Here’s a preview with just 6 tickets total in my Couchbase bucket.
Data Visualization Dashboard
Finally, I’m going to create a dashboard with this data visualization on it. Go to the Knowi dashboard, click “Add Widget to Dashboard” and select the widget. The widget can then be resized and moved around. You can add other widgets for a more complete dashboard. This is what the Reds are working on: just seeing a visualization by itself isn’t enough. They also want to report on the overall trends: what sections are the fullest, how many total tickets have been scanned over a time period, etc.
I created a .NET program (source code available here) to start randomly adding tickets. I wanted to see a real-time update of this data visualization. My example is not entirely accurate: I didn’t want to spend the time mapping every seat to latitude and longitude myself. But it’s close enough for you to get the idea.
(This clip represents a 5-minute period of my sample program running, compressed down into 30 seconds).
The distribution is random, and it’s within two arbitrary boxed areas. This is the part where the Cincinnati Reds have more expertise in actually mapping their data to a more efficient seat map, but hopefully you get the idea.
Note that for a data visualization to be real-time (like above), you can’t use the agent. I had to give direct access to Knowi for a “Direct Query” checkbox to appear when I was creating a data feed (so I used Couchbase on Microsoft Azure).
This particular visualization might also be useful for a real-time outage map for a utility company. You could create a dashboard to report internet, power, gas, or phone outages on a map.
What’s next?
In this post, you saw how easy it was to use Knowi and Couchbase Analytics to start building real-time data visualizations.
Couchbase provides the flexibility of N1QL and the performance of a memory-first architecture, and Knowi provides the data visualization and dashboard capabilities.
Remember that Knowi has a free trial. I’ve worked with Knowi on this Reds project only for a short time, but I’ve found their support to be helpful and responsive and their documentation to be complete and useful.
Some next steps for you:
- Download Couchbase Server for free and try out Couchbase Analytics (currently included as a developer preview in Couchbase Server 5.5)
- Sign up for a free trial of Knowi today.
- Got a Couchbase question? Ask on the Couchbase forums.
- Got a Knowi question? Check out the Knowi Help Center.
- Got a question for me? I’m on Twitter @mgroves.