
Couchbase Cloud Analytics Service
The Couchbase Analytics Service, a cornerstone feature of Couchbase Server 6.6, is now available on Couchbase Cloud. This means you can take advantage of a powerful MPP-based analytics service that provides a parallel data-management capability; allowing the running of complex analytic queries against millions of records without any impact to overall database performance. What’s even better, the Analytics Service is included in the Couchbase Cloud Self-Service Free Trial! But what’s the best way to get your arms around the capabilities of the service, and where do you start? How about with a step-by-step guide?
In this post I’ll explore the 3rd in the Couchbase Cloud Free Trial Tutorial series: Analytics and BI with Couchbase Cloud.
As I mentioned in my previous post, the primary goal of the tutorial series is to show how easy it is to get up and running on Couchbase Cloud, and to guide you through simple examples of functionality that yield quick results. Each tutorial is designed to be succinct, these are not deep technical dives, but they do link to more granular details in the Couchbase Online Docs for every covered feature.
Leveraging Analytics for Business Intelligence and Data Visualization
The Analytics Service is an integral part of Couchbase Cloud functionality, eliminating the need for moving data into a separate layer for analysis – now you can run analytical and operational workloads in a single platform. You can also ingest, consolidate, and analyze data from multiple Couchbase data clusters, and work with the data using N1QL.
The service is ideally suited for analyzing data using BI tools, as it’s speed and efficiency can provide real-time insight for visualizations and dashboards. In the tutorial, we walk through examples of creating Analytics Datasets and querying data using the Analytics Workbench. We also walk through the process of connecting to Couchbase Cloud Analytics from Tableau Desktop, leveraging the CData JDBC Connector For Couchbase. By following the tutorial steps, in just a few minutes you create this map visualization depicting all brewery locations in the “beer-sample” data bucket.
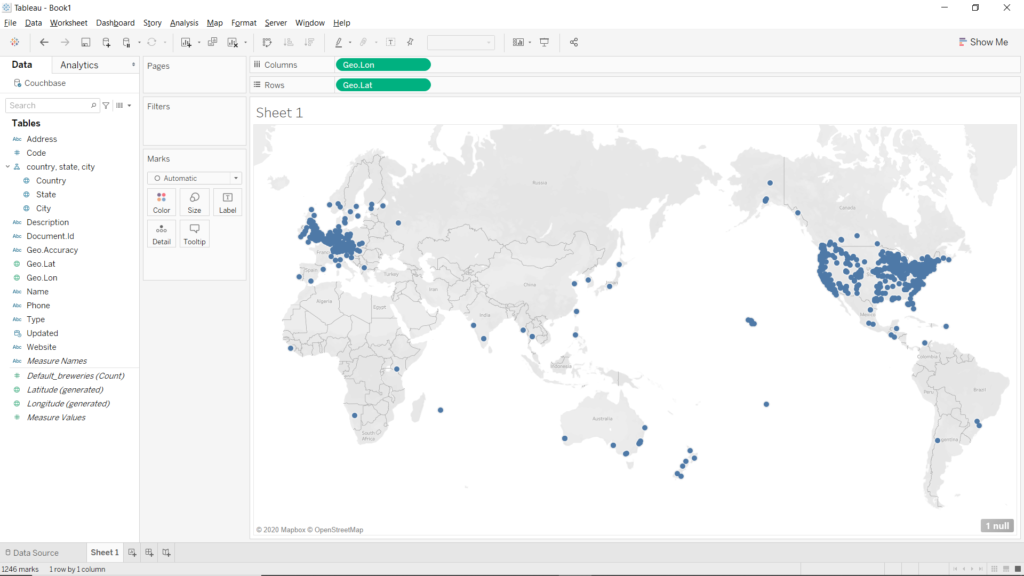
Couchbase Cloud Analytics Data Visualization
The Analytics and BI with Couchbase Cloud tutorial only takes a few minutes, be sure to get the Couchbase Cloud Free Trial and see for yourself!
We hope you enjoy the tutorial series, and look forward to your success with Couchbase Cloud!
Mark – mark.gamble@couchbase.com
well summarized mark! great to see analytics service seamlessly integrated with couchbase cloud and leading industry BI platforms.